OPERATIONS
Enhancing Operational Visibility with a Power BI Well Performance Report
By consolidating key performance metrics into an interactive, easy-to-understand dashboard, we enabled real-time insights for better decision-making and improved performance tracking.
Executive Summary
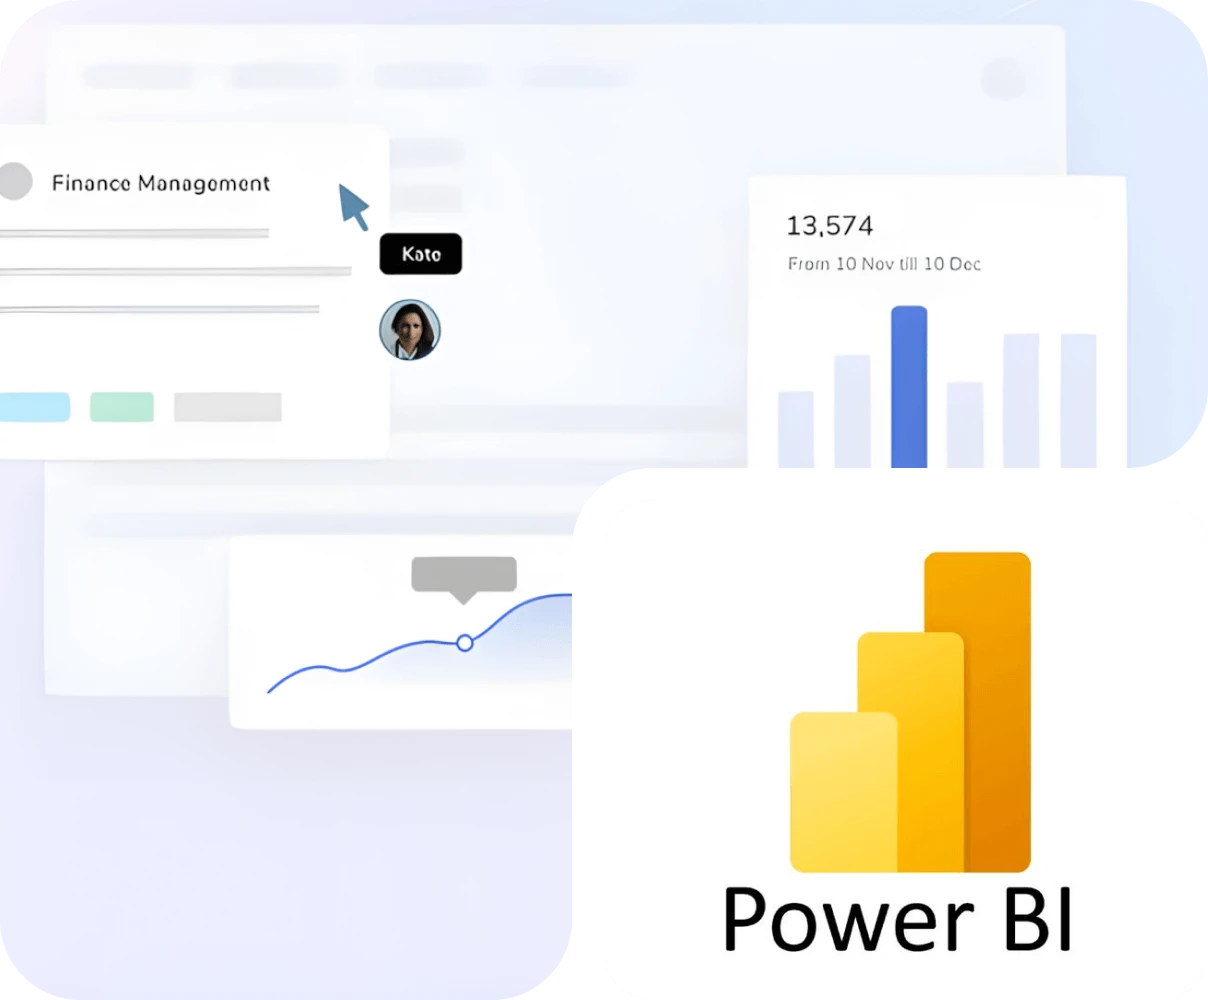
Timalytics Consulting partnered with an independent upstream oil and gas producer to design a Power BI–based Well Performance Report that centralizes operational data, improves visibility, and strengthens decision-making across technical and management teams.
By turning scattered field information into a unified analytics dashboard, the organization gained real-time insights into production patterns, well health, and performance trends, resulting in faster decisions and more efficient operations.
The Challenge
The client managed a portfolio of producing wells spread across multiple locations, each generating large volumes of technical and operational data. Prior to engaging Timalytics, this information was stored across:
Isolated spreadsheets
Department-specific databases
Manually updated reports
This fragmentation created several operational hurdles:
Limited visibility into well performance across the field
Time-consuming manual reporting cycles
Difficulty identifying production issues early
Delayed communication between subsurface, production, and management teams
The client needed a single source of truth where decision-makers could quickly understand what was happening across their wells without digging through multiple documents or waiting for consolidated weekly reports.
Our Solution
Timalytics Consulting designed a custom Power BI Well Performance Report that provides end-to-end visibility across the client’s wells.
Built with a clean structure and flexible drill-downs, the dashboard allows users to move from high-level production summaries down into well-by-well operational details.
Key Components Included:
Daily and monthly production summaries: Aggregated views showing total output across all wells.
Well-level performance analytics: Production behavior, downtime patterns, variances, and trendlines.
Exception monitoring: Quick identification of wells requiring technical review or intervention.
Automated data refresh: Eliminates manual consolidation and ensures management always sees the latest numbers.
Role-based access controls: Ensures each team only sees information relevant to their work.
The report was designed to be intuitive for both technical staff and non-technical stakeholders, ensuring organization-wide adoption from day one.
Impact on Business Processes
The new Well Performance Report quickly became the operational heartbeat of the organization. By moving from spreadsheets to dynamic analytics, the client experienced significant improvements across several areas:
Faster Decision Cycles
Teams no longer waited for end-of-week summaries. Real-time data allowed engineers and management to act quickly when production anomalies appeared.
Improved Operational Efficiency
With clear visibility into well performance and downtime, teams could prioritize interventions more effectively and allocate resources where they mattered most.
Data Consistency and Reliability
Standardized metrics removed discrepancies between departments, improving communication and collaboration.
Better Planning and Forecasting
Historical trends and automated variance tracking enabled data-driven forecasting and production planning.
Reduced Reporting Workload
What previously took hours of manual compilation now happens automatically, freeing technical teams to focus on value-adding analysis instead of repetitive reporting.
The organization gained both clarity and control, turning field data into accessible intelligence for everyday operational decisions.
Why It Matters
In upstream operations, timely and accurate well information is essential. Small delays in detecting performance issues can lead to production losses or operational risks.By giving the client a unified, automated reporting system, Timalytics helped create a culture where decisions are guided by current, credible, and connected data.
This project demonstrates how digital dashboards can strengthen the backbone of oil and gas operations, even without changing existing field systems—by simply organizing and illuminating data that already exists.